Inhabiting a map
a contribution by media artist Michail Rybakov

Michail Rybakov is media artist, researcher and member of the »Critical Zones study group« at Karlsruhe University of Arts and Design. The main topic of his work is embodied interaction and human experience in the post digital world.
»The map is not the territory!« Bruno Latour would exclaim quite often during the research seminar organized in preparation for the exhibition »CRITICAL ZONES«. »The menu is not the meal!« some of the participants would reply, and and I would think – sure, maps are faulty abstractions of our idea of the physical world, but if they were just the right kind of faulty, they could be much more interesting.
So, I decided to bend the representative function of maps just to the breaking point and not further.
Before I introduce my experiments, I’d like to talk about a special map that I encountered when researching this topic.
These are Ammassalik wooden maps: carved, tactile maps of Greenland coastlines.

They were designed to be read by hand, they float in water, they can be stored in a mitten and be read by night, snow or in any other condition. They are carved pieces of wood and still they are maps. These wooden maps also serve as a great illustration of parallel map theory of hippocampal function – a theory of how our brains maps the surroundings, developed by Lucia F Jacobs and Françoise Schenk. It implies that the spatial dimension is encoded in the hippocampus using a combination of mapping systems – a bearing map that represents the relations between objects, and a topographic sketch map similar to a conventional land map. The mental maps we use to navigate the world are created and stored by combining both systems.
The interesting thing about the Ammassalik wooden maps is, that it seems to be a purely relational, vector map, presenting distinct landscape features in relation to each other. This is in stark contrast to the traditional western map that we grew accustomed to, which takes the second, topographic, top-down approach.
My first experiment was to find some middle ground between the two mapping techniques: starting with the topographic approach, I would make it mutable, less stiff, move it towards a relational map. I created a script that gradually removes empty spaces from a map using a seam carving algorithm.

Zwischenbäume
This process compresses the maps, at the same time preserving all the important features and relations between objects and raising the information density. All for the small price of making the distance between depicted features a very speculative thing.
Arguably, distance »is« a speculative thing if we remember how wildly different the same distance will be perceived by a person climbing a mountain and a person driving a car through the tunnel in the same mountain, or between two lovers going for a walk and a schoolchild walking home from a badly failed test.
When followed up by an expanding step the algorithm produces some kind of a living, breathing map.

Inhabiting a map. Breathing Map
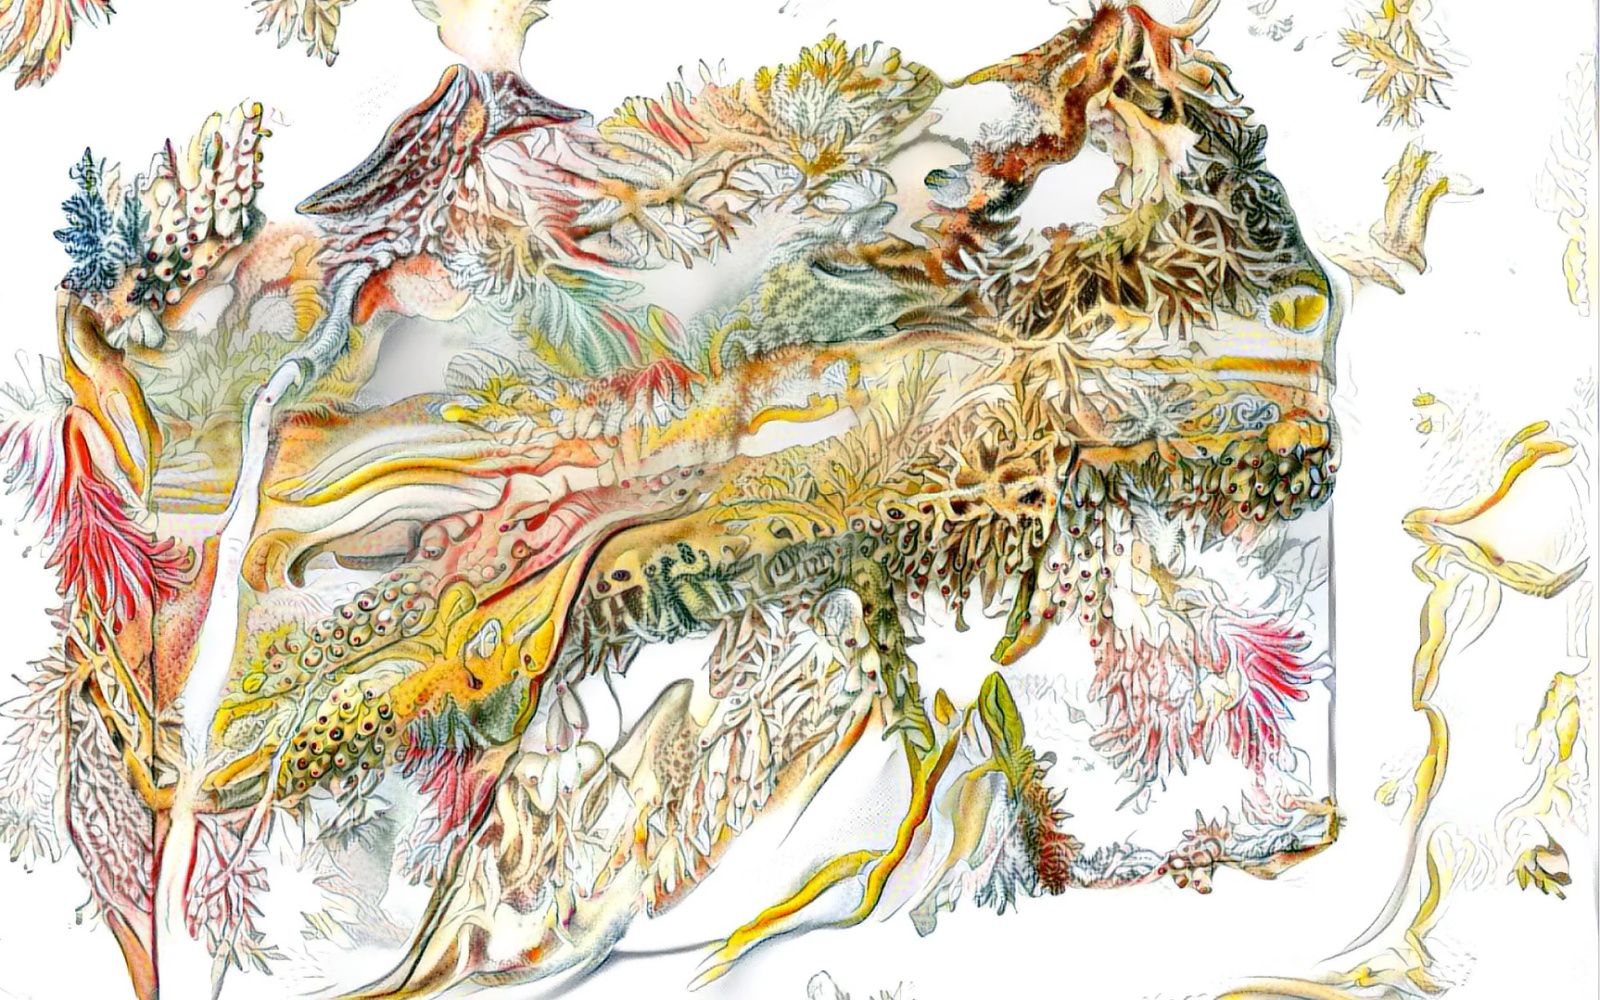
Encouraged by the success of the experiment I decided to try similar things with block diagrams, which are often used to illustrate complex system dynamics in earth sciences. With the same goal – to make them seem less immutable, less self-righteous, more relational.
Here, I used the »neural style transfer« algorithm to apply details and textures of animal illustrations to block diagrams of landscapes in which these animals might or might not live. The neural style transfer algorithm takes the block diagram as, in a way, a substrate, which is then populated by details and textures of the animal illustration.

Tafel 54. Gamochonia. Trichterkraken X Climate Change in California. Department of Water Resources, June 2007.

I didn’t take just any illustrations – I used those created by Ernst Haeckel, the German biologist, philosopher and artist who coined the term »ecology«, meaning the relation of the animal to its organic and inorganic environment. The resulting graphics provide a new take on »ecology«, blurring the border between the animal and its environment.
Tafel 66. Arachnida. Spinnentiere. X Water resources of the Sabana Seca to Vega Baja area, Puerto Rico.

Tafel 72. Muscinae. Laubmoße. X Carbon capture and storage.

Tafel 40. Asteridea. Seesterne. X Saltwater intrusion in coastal aquifers.

Tafel 43. Nudibranchia. Nacktkiemen-Schnecken X Urban drainage.

Tafel 73. Muscinae. X Relative dating principles.

Tafel 40. Discomedusae. Cannorhiza. X 2010 Haiti Earthquake.

Tafel 8. Discomedusae. Scheibenquallen. X Ground water and climate change, Taylor et al. 2013.

Inhabiting a map. Visualizing Complexity
As the algorithm is non–deterministic, a few runs of it create what seems to be moving, living landscapes.
Later I returned to the concept of »organism as part of its surroundings« by inverting the process: instead of applying the organism to its environment, I applied the environment to the organism. For the sake of simplicity, or perhaps in an attempt to actually find what nourishes our bodies, I took the human being as the organism.
On the technical side I combined two AI techniques: body recognition and in painting. The human body is recognized, then removed from the footage and quite literally replaced by a blend of the environment it was found in. The result is a ghost–like experience, »we are made of woods«, you could think, »we are made of rock«.
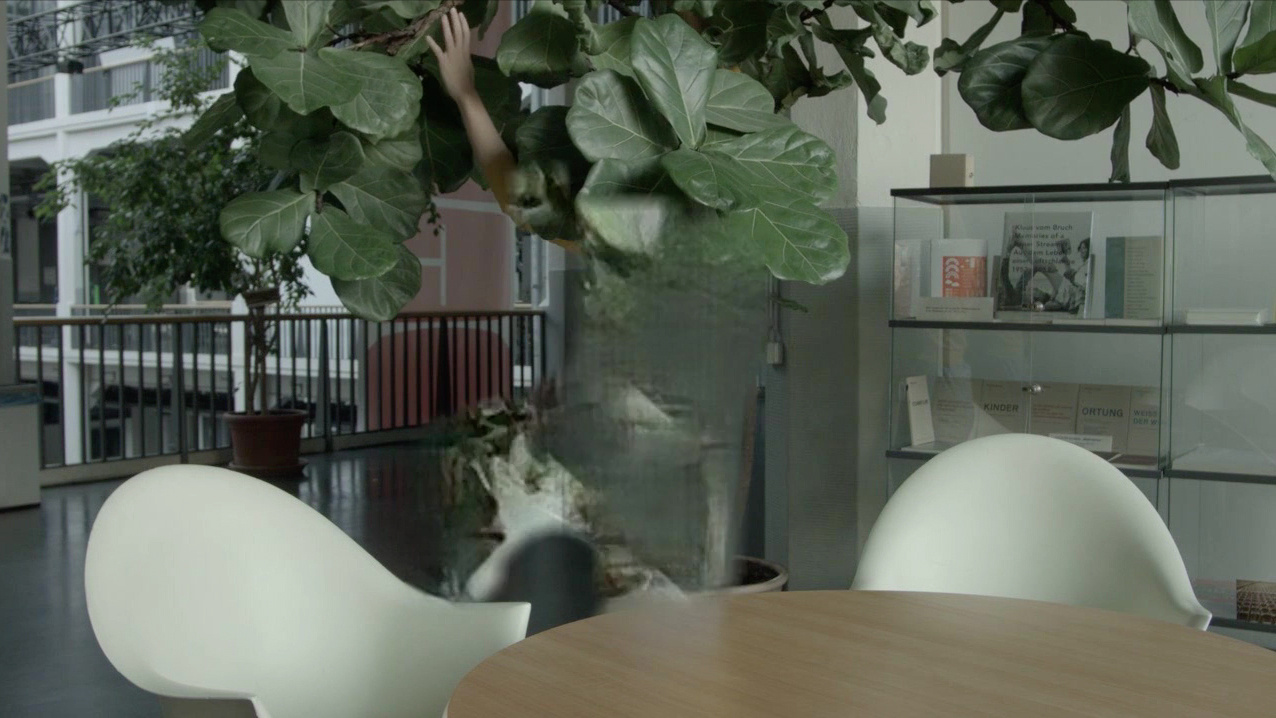
Michail Rybakov: Inhabiting a map. People Ghoster
Mira Hirtz performed for the algorithm.
It is impossible to inhabit a map. But it is, perhaps, possible, to make the maps a tiny bit more hospitable, more in tune with the processes that take place within the represented space. And perhaps the »grounding« that we all need in order to, in the Latourian sense, land on earth, could take the form of an actual grounding – being made of the ground that sustains you.
A contribution by Michail Rybakov.
See more of Michail Rybakovs' works and essays on his website.