Human Mobility
2008–2020
")
-
predictability
-
COVID-19
-
mobile-phone call network
-
mobility patterns
-
x
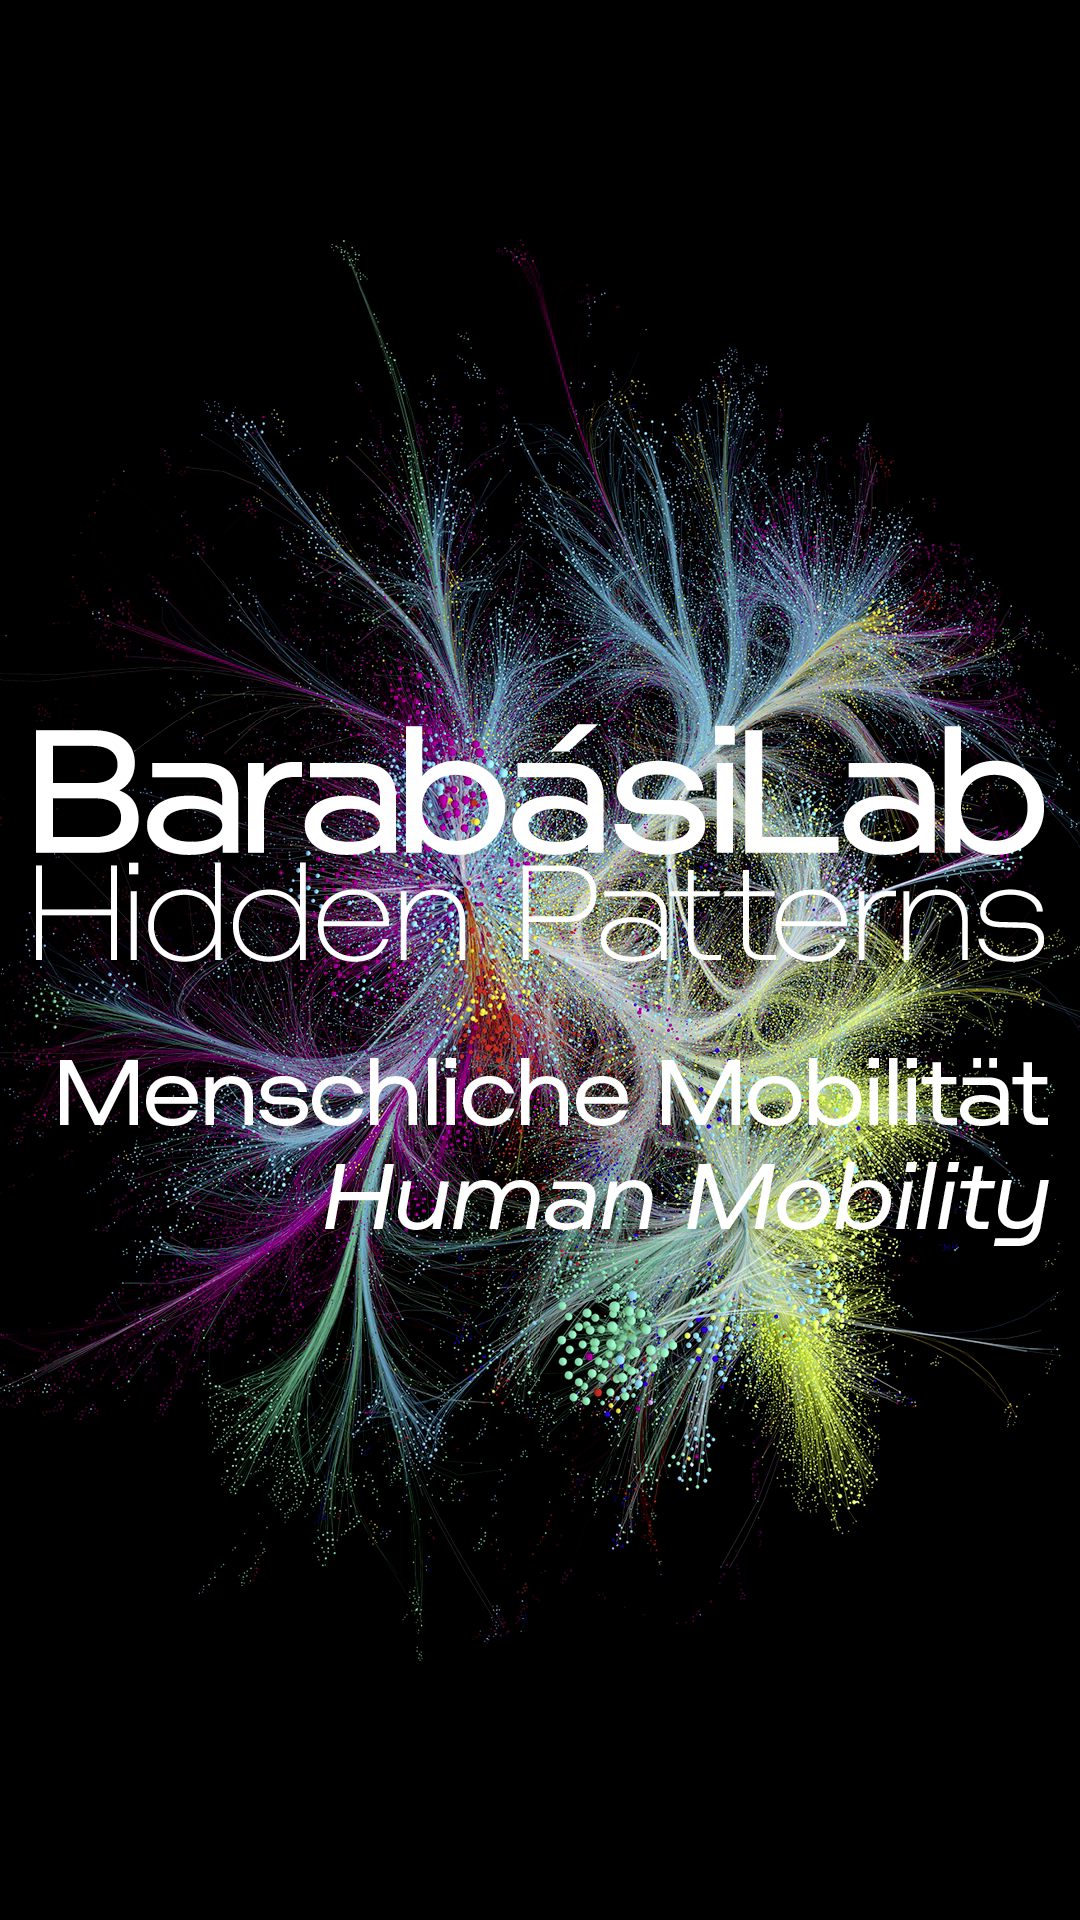
Human Mobility | video commentary by Albert-László Barabási
Human Mobility | video commentary Albert-László Barabási
The various visualizations presented here on the topic of human mobility are based on data collected by mobile-phone network providers and the analysis of tweets on Twitter. The works capture the spatial and temporal movement patterns of people and how these have changed due to the effects of the COVID-19 pandemic. They also reveal the predictability of everyday human behavioral and communication patterns. As these mobility and communication networks also facilitate spreading, the works illustrate transmission patterns taken up by viruses and fake news.
")
")
The first scientific paper by BarabásiLab on mobility appeared on the front page of the journal Nature on June 5, 2008, under the title »Understanding Individual Human Mobility Patterns«. The research relied on data collected by a European mobile-phone company to record the physical locations and time histories of individual mobile-phone users. The »Mobility« visualizations show examples of individual movements over time, allowing geographic movements to be retraced by stringing together real-time locations. The data also shows the exceptional predictability of daily routines: through algorithmic analysis of the anonymized data sets, BarabásiLab could predict a person’s future location with 93 percent accuracy. The two »Rhythms« graphics trace the paths of two people who move around a large city with varying degrees of predictability. While one person visits about a dozen places, the other visits about a hundred. The space depicted is divided into a Voronoi grid that captures the reception areas of all the mobile-phone towers positioned there. These partitions illustrate the way space constrains human mobility. Traffic routes are not the only factor influencing our daily movement patterns; socio-economic existence is also shaped by invisible structures.
")
Emergencies (2011)
-
Networks of stress
mobile call network
human reactions
contact tracingTo better understand how human behavior changes during crises, BarabásiLab evaluated the mobility and calling patterns of witnesses to various emergency situations. This procedure was a precursor to contact tracing, which has been used, for example, to control COVID-19.
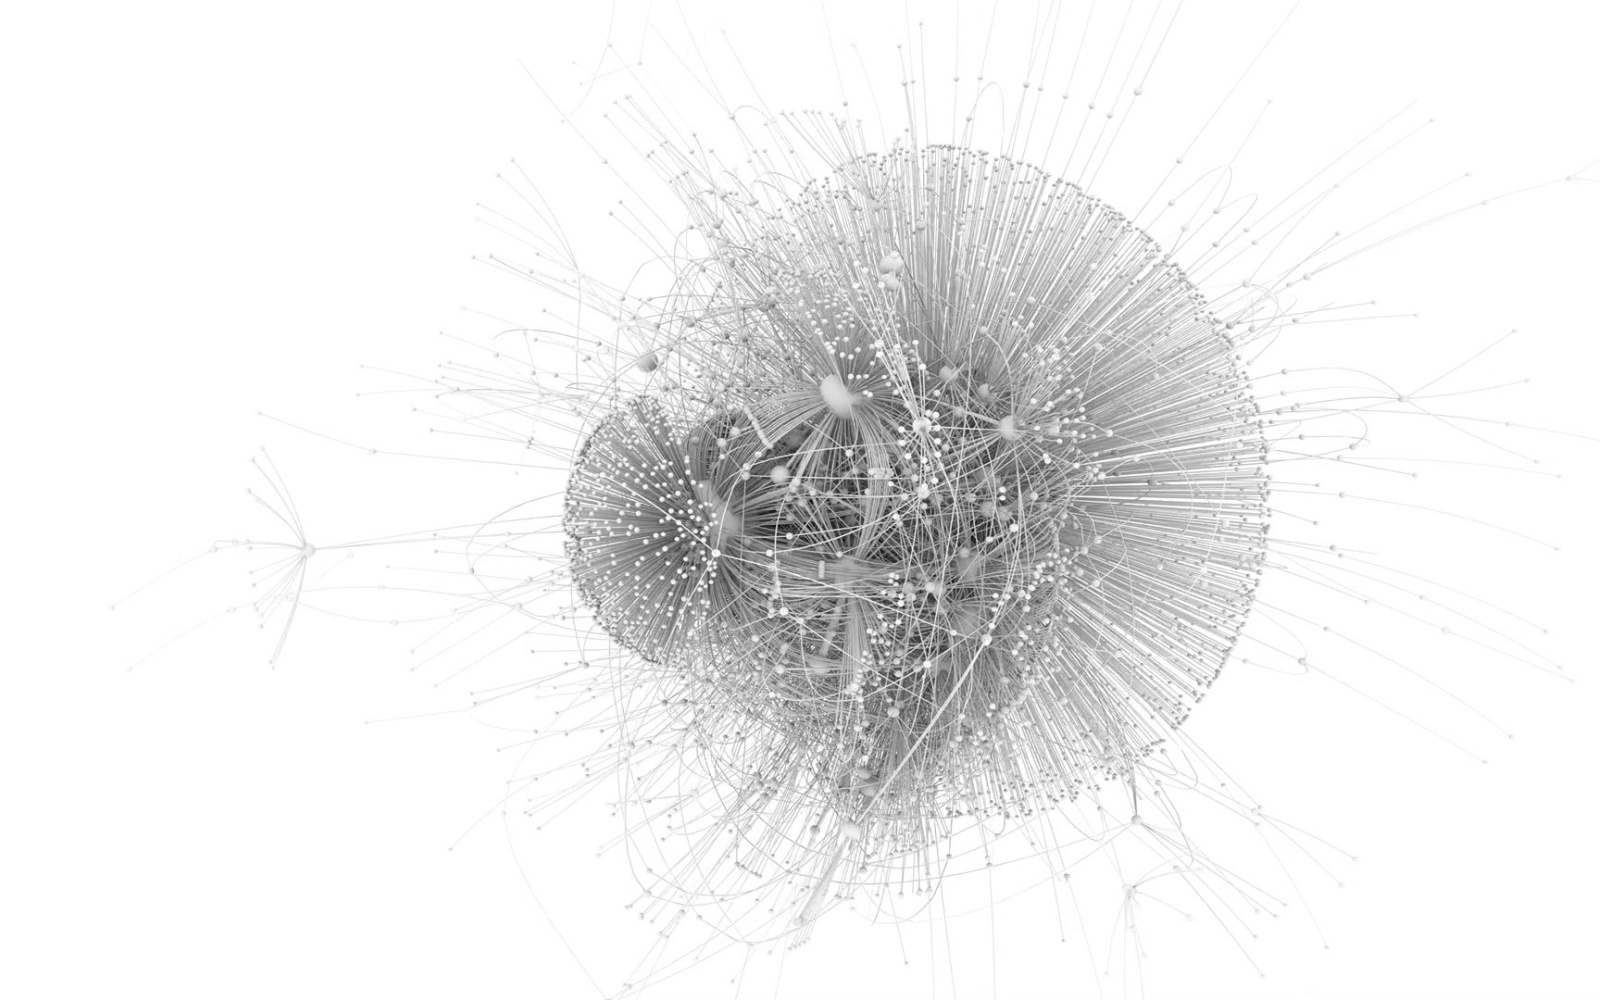
The networks in »Emergencies« record the calls made after two separate bombings: the red graph visualizes the mobile calling patterns immediately after the explosion of a bomb in Barajas Airport in Madrid in 2006, while the green graph captures the sudden change in calling patterns after an exploded car bomb in the Basque Country in 2009. The calls from the immediate witnesses of the events are shown as squares; those from acquaintances made after hearing the news are shown as circles. The larger the symbol, the more calls have been made. The colors record the time. The increasingly blue color spectrum represents individuals at the end of the chain of calls, to whom the news arrives later.
These visualizations describe the sensitive fabric of social networks that spring into action in the face of emergency. They also show that while most news will dead-end in small pockets of these networks, a very small number of witnesses will create global awareness by triggering the engagement of hundreds of individuals.
")
")
Fake News (2018 )
-
The spread of #Pizzagate
social media
news distributionThe spread of fake news is empowered by social media. This is illustrated by the Pizzagate scandal, a conspiracy theory that affected the 2016 US election and is considered the first well-documented fake news event. High-ranking Democratic Party officials were claimed to be running a prostitution ring in the basement of a Washington, DC pizza parlor.
In order to capture the emergence and spread of fake news such as the Pizzagate scandal, and to understand the important role of bots in that spread, BarabásiLab developed the »Fake News« network. It depicts the spread of tweets sharing the hashtag #pizzagate on Twitter. Using a botometer, an artificial intelligence tool that separates humans from bots, it was possible to determine whether the tweets were retweeted by bots, that is, program-driven accounts, or by real persons. The tweets created by bots are visualized as ochre-colored nodes, while those of real persons are turquoise. The links between the nodes represent retweets via the hashtag #pizzagate.
")
")
Albert-László Barabási, Mauro Martino, Nima Dehmami, Onur Varol, »Fake News«, 2018
BarabásiLab, »Fake News«, 2018
Fake News | video commentary by Albert-László Barabási

Fake News | video commentary Albert-László Barabási
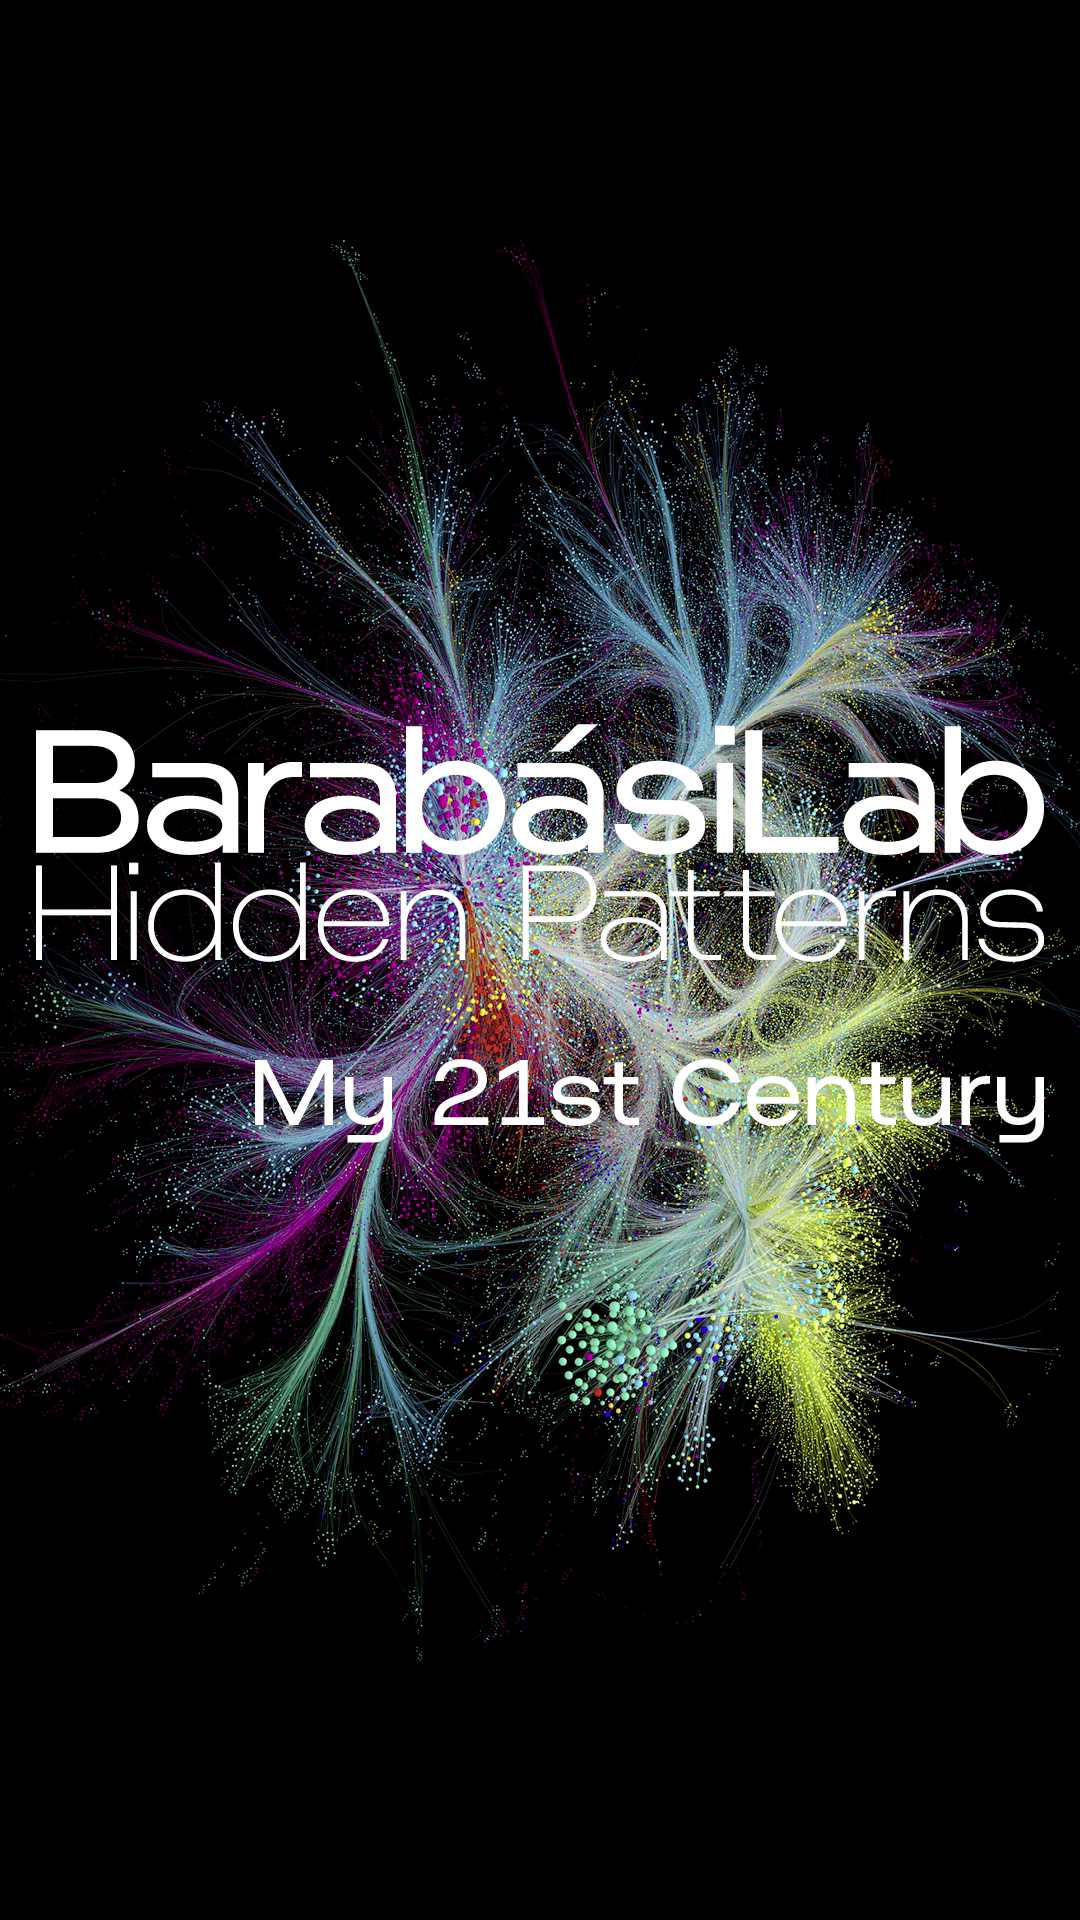
My 21st Century (2020)
-
Breathing New York
COVID-19
mobility patterns
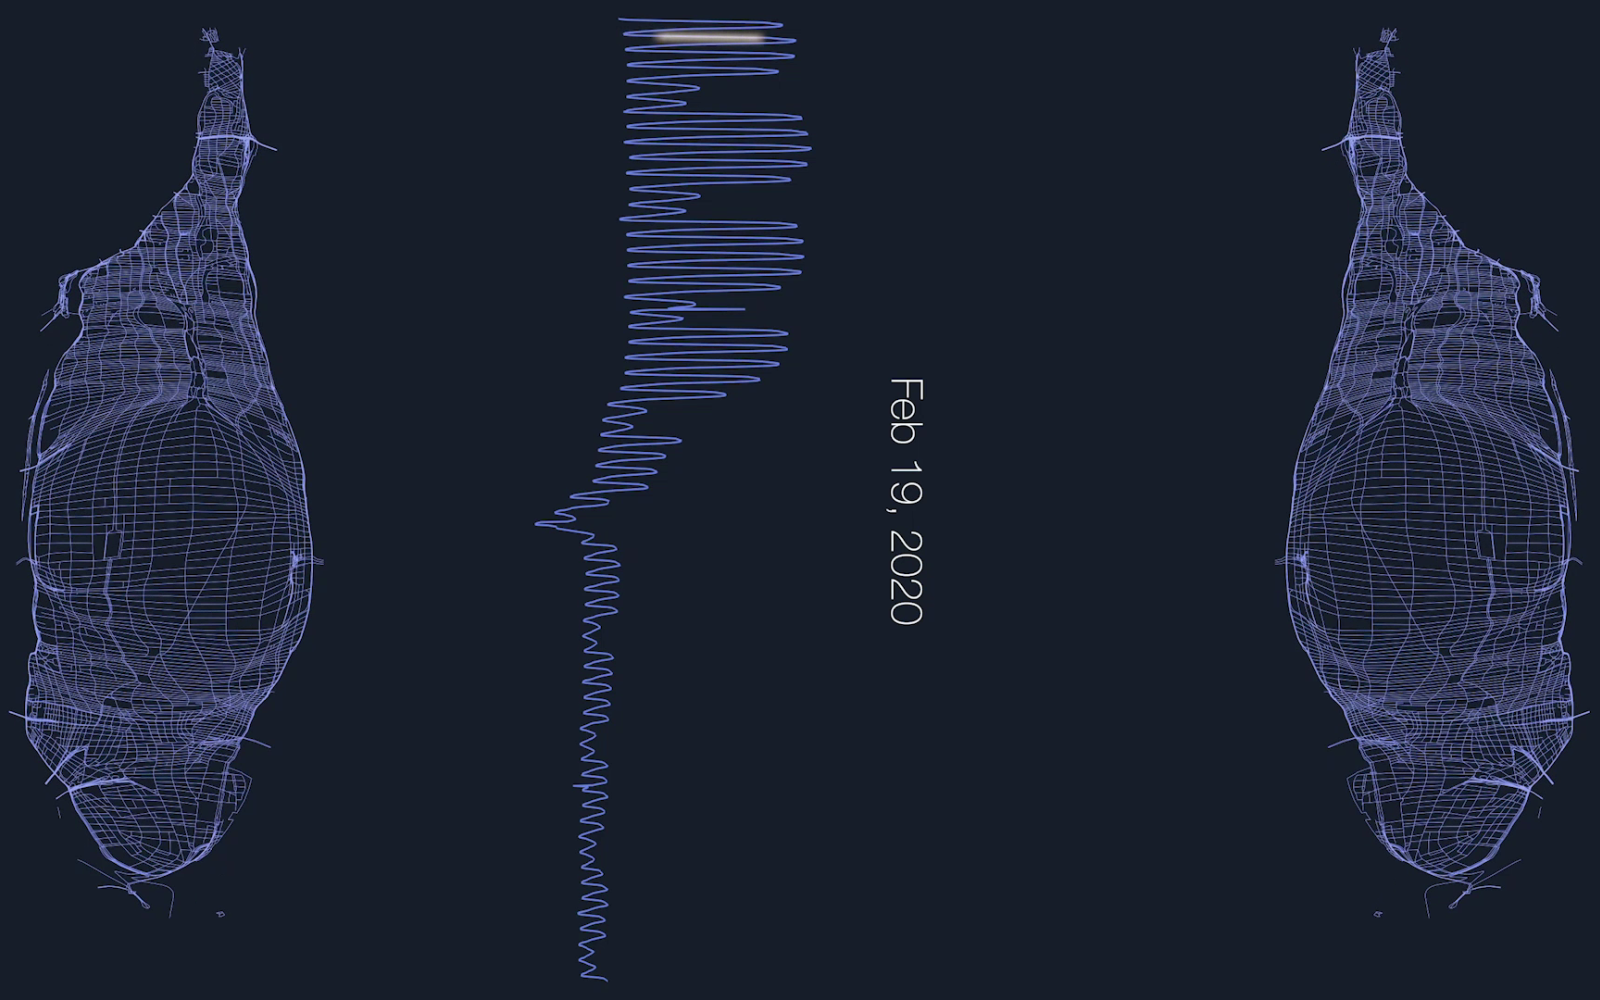
lockdownThe video »My 21st Century« leads the BarabásiLab’s scientific examination of human mobility to a highly topical implementation. By analyzing the mobile-phone data of mobile-phone users in Manhattan, New York, before and after the outbreak of the COVID-19 virus, the Lab makes visible the extent to which human behaviors changed as a result of the pandemic.
The map of Manhattan shows the daily rhythm of the population’s movement. Like breathing lungs, the cartographic representation enlarges with the arrival of people in the morning and contracts as they leave the city towards evening. On March 22, the first day of the lockdown, the city goes into a shock and the maps collapse. After that day the rhythms of movement within Manhattan return, but with a reduced amplitude, reflecting the new post-pandemic normal.
Albert-László Barabási, Michael Danzinger, Alice Grishchenko, Ryan Qi Wang, »My 21st Century, Breathing New York«, 2020
BarabásiLab, »My 21st Century, Breathing New York«, 2020
My 21st Century | video commentary by Albert-László Barabási
My 21st Century | video commentary Albert-László Barabási
Viruses (2009)
-
The Emergence of a Pandemic
predictability
mobile phone data
spreading of virusesA decade before the coronavirus pandemic, BarabásiLab was already trying to understand how viruses spread globally across national borders. To do this, the team analyzed data from various mobile-phone companies to map the spread of a potential mobile phone virus and predict its transmission pattern. The pattern this exercise unveiled is strikingly similar to the pattern observed during the asymptomatic spread of the COVID-19 virus.
The »Viruses« series documents the temporal and spatial spread of infection in an area of Europe. Running from left to right, the sequence shows how a mobile-phone virus, starting in a rural area and passed on through physical proximity, first infects densely populated regions and then spreads from urban to rural areas until it becomes widespread. The Voronoi grid marks the area of reception of a mobile-phone tower for each partition. The colors of the cells correspond to the percentage of infections within each region; the infection rate increases from colorless to blue to red cells.
")
")
")
")
")
")
Viruses | video commentary by Albert-László Barabási
